Waterfall charts
Udzielono odpowiedziHi there,
I'm trying to create a waterfall chart like the one below. Is it possible to do that in workiva? Thanks

-

Hello Federico,
Yes, there is indeed an option for waterfall charts in Workiva! You will navigate to the 'Chart' dropdown on your edit tab and then you can select 'waterfall.' (see image below)
Additionally, to add data you can right click on the chart you have inserted and go to 'View chart data.' You are also able to adjust the appearance of the chart under 'Chart properties' in your right hand panel.

Let us know if you have any additional questions. Thanks!
0
Here is a helpful article that goes through adjusting the chart properties.
0
I know we can make waterfalls in the workiva presentation platform but can we make waterfall in Wdesk spreadsheet?
0
Hello and welcome to the Community, Prakriti! Thanks for chiming in.
Unfortunately inserting a chart in a Workiva Spreadsheet is not yet available, though it is planned to be added (see here). I'll get you added to our list and will keep you updated. Let me know if you've got any questions for me in the meantime.
Cheers!
Mike
0
Question with regards to the original table - for the "waterfall" format, you are not able to stack separate data types to create the bars that you see in the screenshot in the original question. Do you know if there is a plan to add the functionality to stack different data types in Wdesk? For example, this would be helpful to reflect an investment portfolio with changes quarter over quarter. You would want to break out the portfolio at a given date (i.e. quarter-end) to break out debt securities / short-term investments / cash / alternatives etc.
Thanks!
0
Hi Alex Bates!
There is not currently a plan in place for adding stacked columns to waterfall charts. There are some idea tickets out there from numerous other companies, so it is definitely in the teams sights! I have spun up an additional ticket for you and you will be added to the list. Every little bit helps as far as requesting of a new feature, so thank you! When there is movement on this idea, you will be notified!
0
Is there a way I can move the zero bottom axis bar to true zero? This would then show the negative amounts under the zero line and positive amounts above?
0
Further ideas to waterfall graphs: At the moment the waterfall graphs can prepared without connection-lines and the (total) columns cannot be scaled down. It would be great to add the following functions:
- (total) columns can be scaled down
- connection lines can be added
See therefor an example: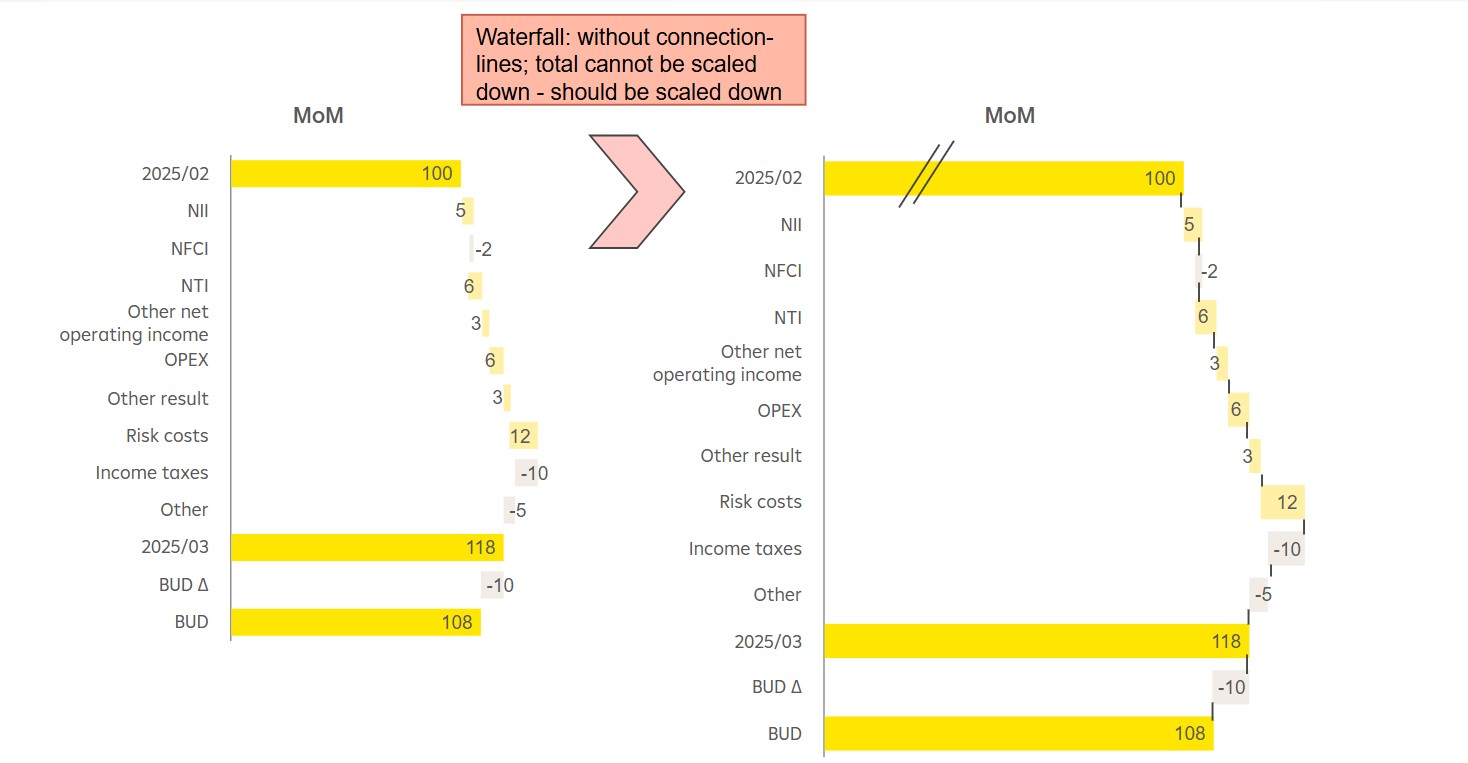 0
0
Thanks for sharing this Annemarie Lackner!
Sorry to have missed your question Sydney Wallerius. Here's some steps to follow. Let me know if this does not accomplish your needs and you are looking for a feature add and we'd be happy to get that feedback in for you.
To move the zero bottom axis bar to true zero in your chart, you can use the following steps:
- Show Zero Line: In the Chart Properties panel, enable the "Show Zero Line" option. This will display the zero line on the chart and allow you to adjust its appearance.
- Adjust Axis Range: Modify the minimum and maximum values for the axis to ensure that the zero line is positioned correctly. This can be done by setting the Min Value and Max Value in the Chart Properties.
- Customize Axis Settings: For the left axis, you can reverse the scale or adjust the step size to better display the data. For the bottom axis, you can expand the line to the edge of the chart if needed.
- Ensure Proper Data Representation: If your chart includes both positive and negative values, ensure that the axis range accommodates these values so that the zero line divides the chart appropriately
0Zaloguj się, aby dodać komentarz.
Komentarze
Komentarze: 9