Adjust the size and placement of your charts in your documents for maximum clarity. Edit your chart size to fit the orientation and length of your pages. Charts that are smaller than the page width can be aligned for ideal placement. Use spacing options to add more or less white space to your chart.
Adjusting chart size
When you insert a chart, the default dimensions are 613 pixels wide by 380 pixels tall. This default size is not affected by the size or orientation of your page.
To adjust chart size:
- Select the chart.
- Right-click and choose Chart Properties .
- Adjust the Width and Height in the input fields.
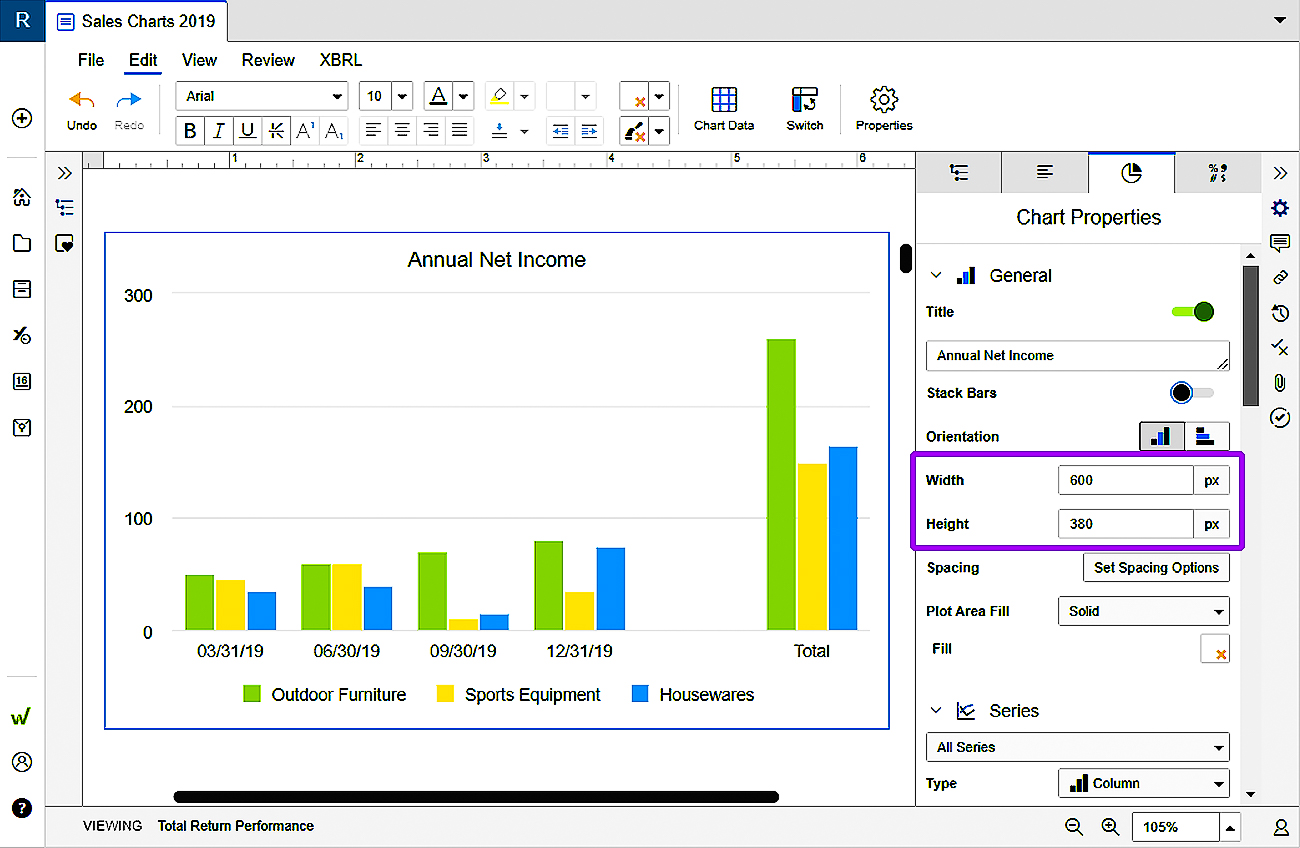
Chart placement
To modify the placement of a small chart:
- Select the chart.
- Go to the Edit toolbar.
- Use the left, center and right alignment icons.
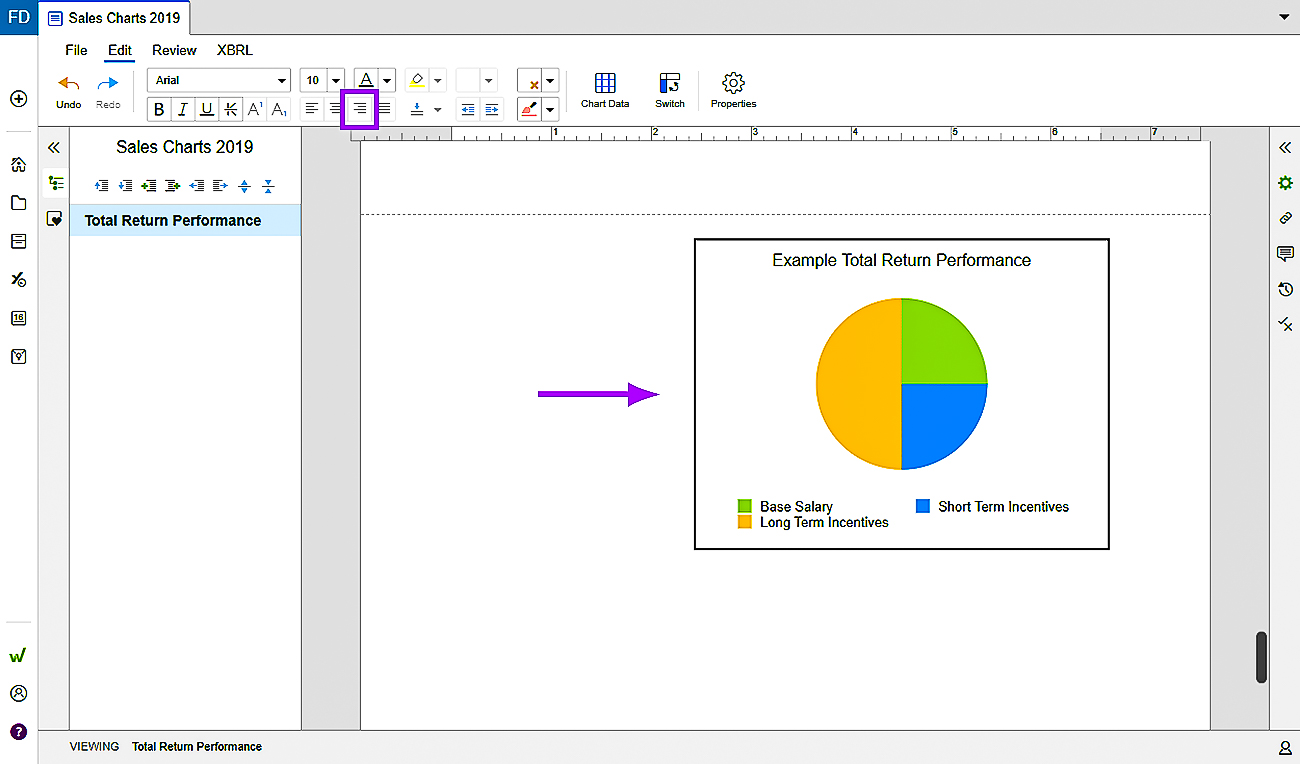
You can also click and drag the chart. As you move a small chart on your slide, guidelines will appear to aid alignment and placement. Use the arrow keys to fine tune the placement of the chart.
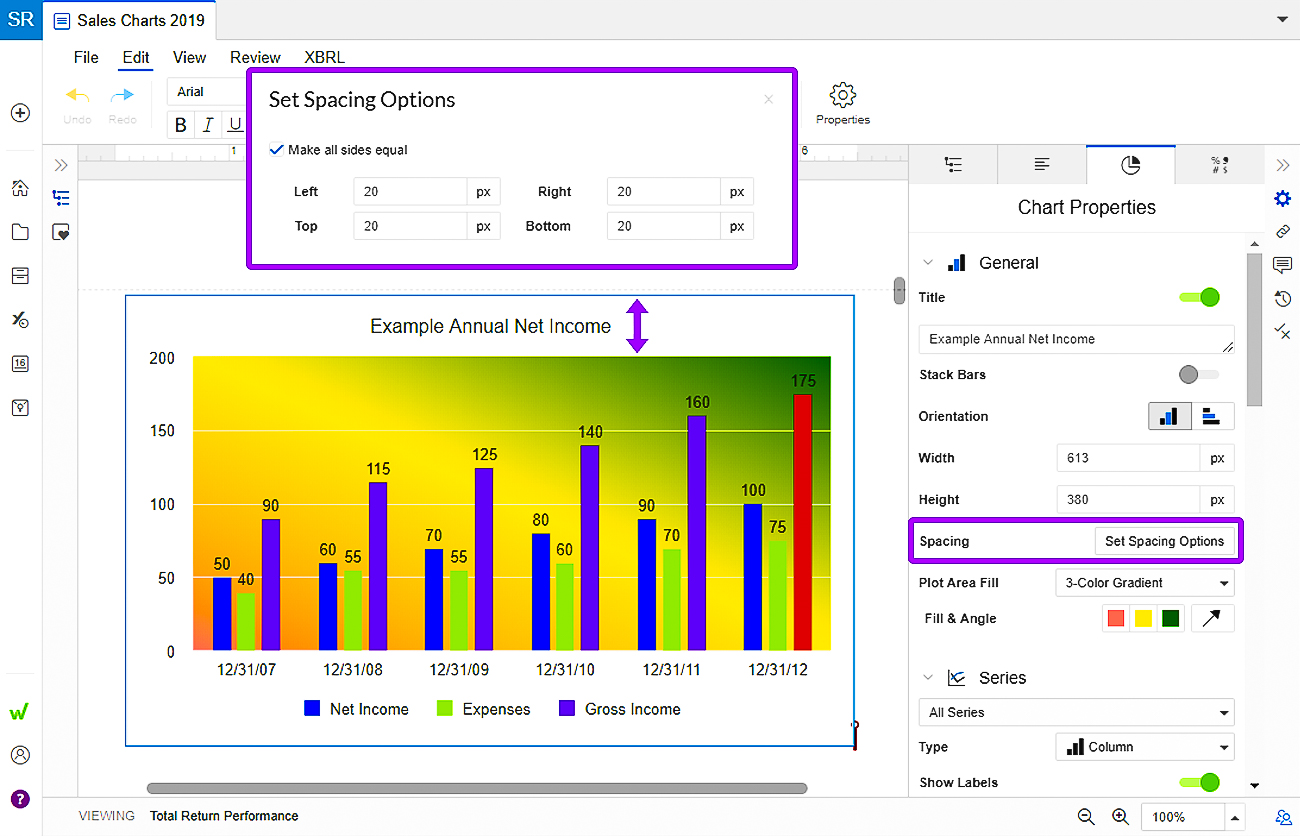
Chart spacing
The spacing feature allows you to determine the amount of space between the chart content and the perimeter of the chart.
- Set the spacing pixels to a lower number for less white space.
- Set the spacing pixels to a higher number for more white space.
To change chart spacing:
- Click on the Set Spacing Options button in the Chart Properties panel.
- In the Set Spacing Options dialog box, adjust the spacing for the left, right, top and bottom. Or check the Make all sides equal box.
- Then adjust any of the options and the others will change to match.