Conditional Line Item Names & Variance Verbiage
What is Dynamic Narrative?
Dynamic narrative is the practice of allowing text within a report to automatically change based on underlying data or business logic. Rather than manually updating wording each reporting period, the narrative adapts as the data changes, helping ensure consistency and accuracy.
Why Implement this?
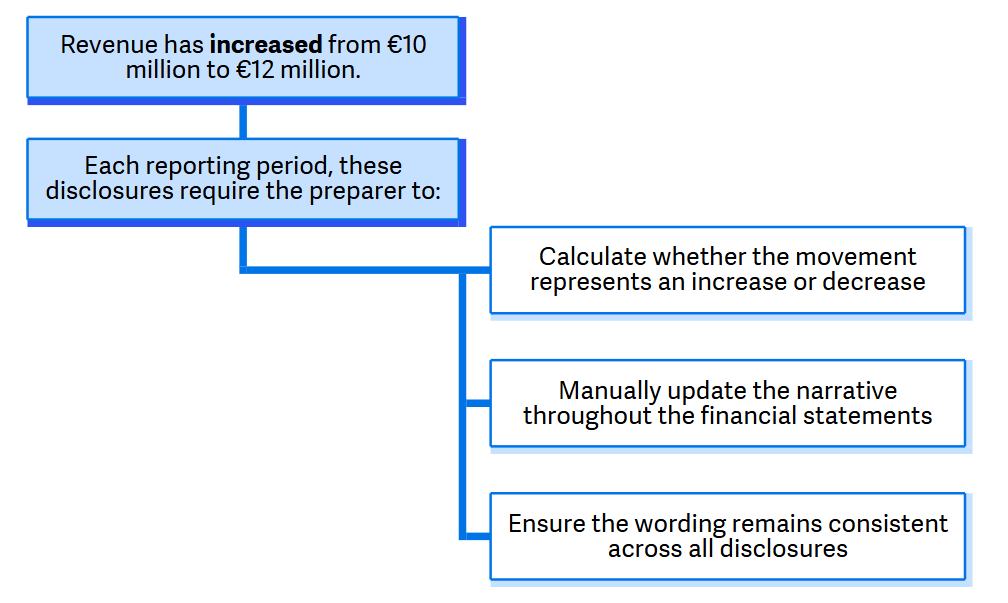
Preparing financial statements often involves manual review of narrative and line item descriptions after each reporting period. Without automation, preparers must manually review these disclosures every reporting period, increasing both preparation time and the risk of inconsistencies. Two common examples are:
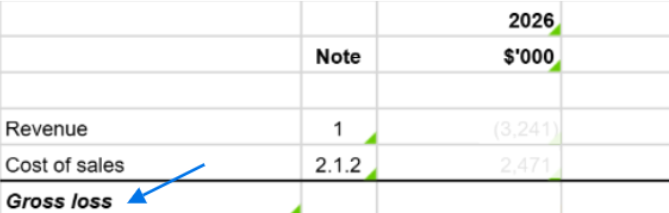
- Financial statement line-item descriptions that can dynamically change based on whether the underlying value represents a profit or a loss.
- Narrative disclosures that describe movements between periods
When to Implement this?
Dynamic narrative is considered a Workiva best practice and should be incorporated into every implementation. At a minimum, it should be configured for applicable line items on the face of the financial statements and/or provided as a reusable Spreadsheet template for use in relevant disclosures. This reduces recurring manual review, promotes consistent wording, and helps ensure the narrative remains aligned with the underlying data.
Use Case 1 – Conditional Line Item Names
Business Challenge
Certain financial statement captions are conditional on the values reported. Without automation, these captions require manual review every reporting period.
Technical Approach
The solution consists of three simple components.
Step 1 – Create a lookup table
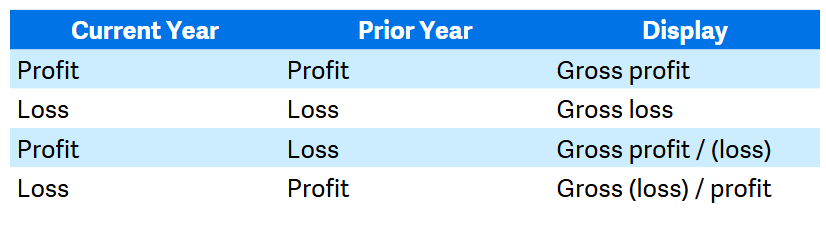
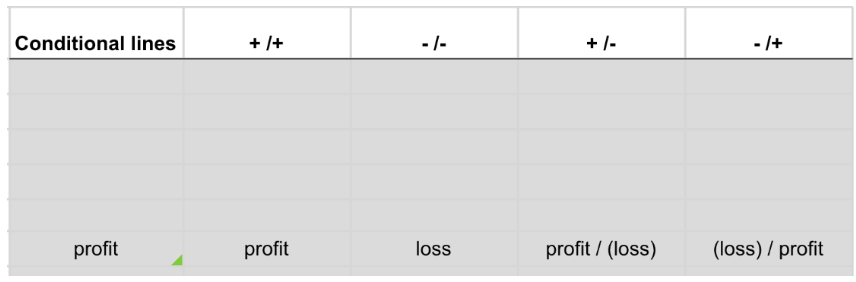
Create a small lookup table containing the four possible scenarios

Step 2 – Determine the correct scenario
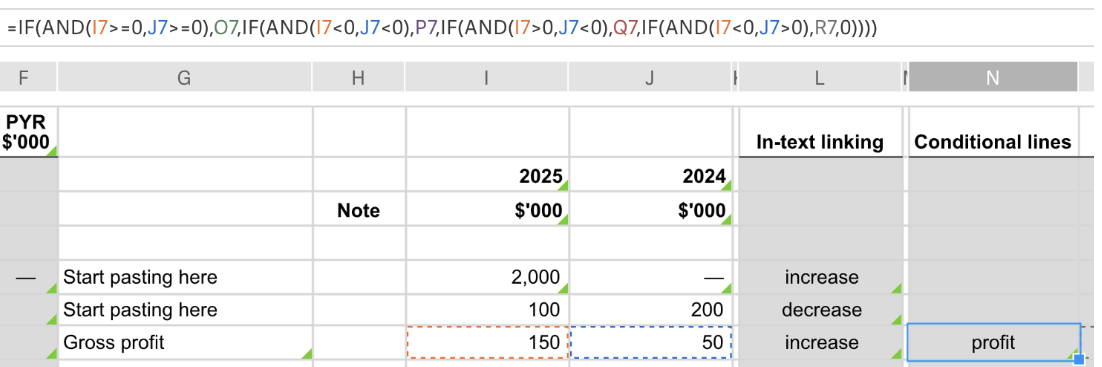
Create a helper column that evaluates the Current Year and Prior Year values and returns the appropriate value from the lookup table.
=IF(AND(I7>=0,J7>=0),O7,IF(AND(I7<0,J7<0),P7,IF(AND(I7>0,J7<0),Q7,IF(AND(I7<0,J7>0),R7,0))))
Step 3 – Build the final line item
Concatenate the static portion of the line item with the helper column
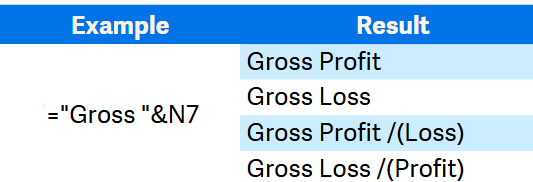
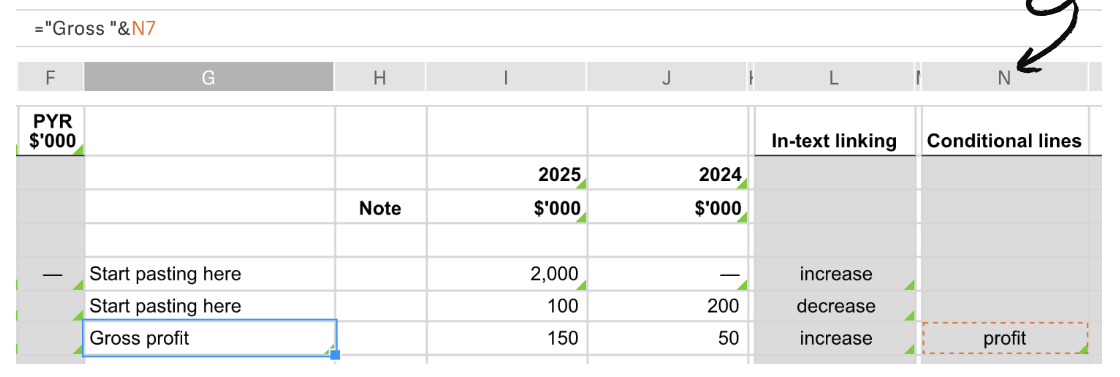
Result
Following each Refresh, the line item description automatically reflects the Current Year and Prior Year values. No manual review or updates to the financial statement captions are required.
-----------------------------------------------------------------------------------------------------------------------------------------------------------------------------------------------------------
Use Case 2 – Variance Verbiage
Business Challenge
Preparers frequently include narrative explaining movements between reporting periods. For example:
Technical Approach
The solution consists of one simple component.
Step 1 – Create helper column(s)
Create a helper column that compares the Current Year and Prior Year values.
=IF(OR(I8="",J8=""),"",IF(ABS(I8)>ABS(J8),"increase",IF(ABS(I8)<ABS(J8),"decrease","no change")))
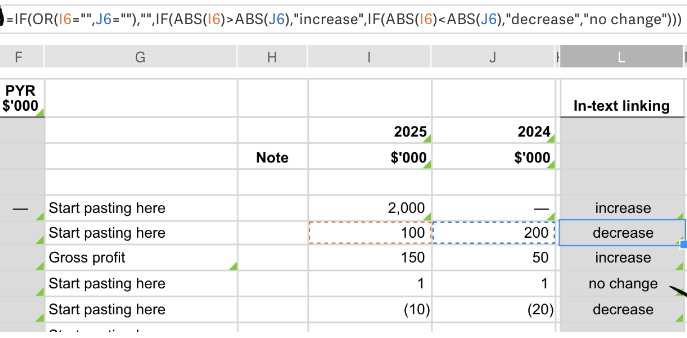
This formula:
- Returns a blank if either the Current Year or Prior Year value is blank.
- Returns "increase" when the absolute Current Year value is greater than the absolute Prior Year value.
- Returns "decrease" when the absolute Current Year value is less than the absolute Prior Year value.
- Returns "no change" when both values have the same absolute value
The resulting text is then linked into the Workiva document using in-text linking, allowing the narrative to update automatically whenever the source data changes.
Result
Following each Refresh:
- The variance wording is recalculated automatically
- Linked narrative updates without manual intervention
- Disclosures remain consistent across the report, regardless of whether the underlying values are positive or negative
-----------------------------------------------------------------------------------------------------------------------------------------------------------------------------------------------------------
Customize
These columns are intended to be customized to align with the needs and established language of the final report. Update the narrative embedded within each formula so the generated wording matches the terminology, tone, and sentence structures used throughout the report.
Another example of this approach is shown in the following variance columns, which provide additional directional language options for linking into the final report narrative. These examples are intended as a starting point and may be modified, expanded, or structured differently to meet the needs and preferred terminology of the reporting team.
Formula by Column:
- =IF(AND(B9<>"",D9<>"",B9<>"Mapping error",D9<>"Mapping error"),B9-D9,"")
- =IF(AND(D9<>"",D9<>0,G9<>"",D9<>"Mapping error",G9<>"Mapping error"),G9/D9,"")
- =IF(AND(G9<>"",G9<>"Mapping error"),IF(G9>0,"above","below"),"")
- =IF(AND(G9<>"",G9<>"Mapping error"),IF(G9>0,"up","down"),"")
- =IF(AND(G9<>"",G9<>"Mapping error"),IF(G9>0,"increased","decreased"),"")
- =IF(AND(H9<>"",H9<>"Mapping error"),IF(H9>0,"an increase","a decrease"),"")
Regardless of the specific design, variance calculations and corresponding narrative outputs should always be incorporated into the solution to support consistent, data-driven disclosures
2
U moet u aanmelden om een opmerking te plaatsen.
Opmerkingen
0 opmerkingen