Documents combo chart : Need to adjust line - percentage vs. numbers
답변함I am trying to move the line up in relation to the bars. When I adjust the axis min and max values and steps, the line moves but becomes flat. The data for the line is in percentages and in numbers for the bars. 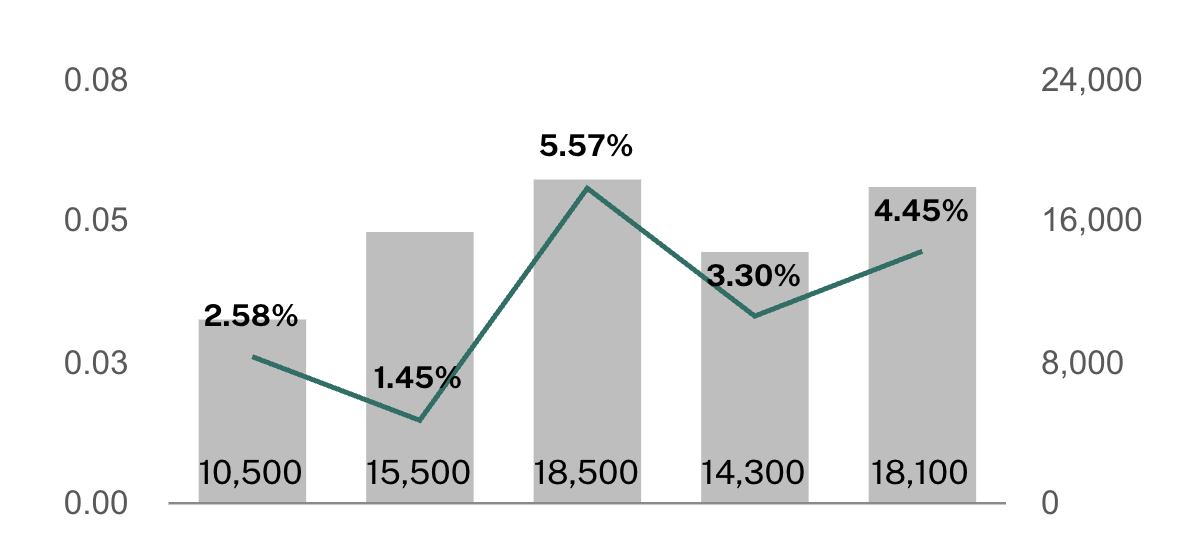
0
-

Hi Michelle Gunnett,
To adjust the line in a Documents combo chart where the line represents percentages and the bars represent numbers, follow these steps:1. Assign Separate Axes: Ensure the line series (percentages) is tied to one axis (e.g., the right Y-axis) and the bar series (numbers) is tied to another axis (e.g., the left Y-axis). This separation allows independent scaling and prevents flattening of the line.2. Adjust Axis Min, Max, and Step Values: For the axis associated with the line (percentages), set theMin,Max, andStepvalues appropriately. Input percentage values as decimals (e.g., 0.03 for 3%) to ensure accurate scaling.3. Use Chart Properties: In the Chart Properties panel, navigate to the Series section. Select the line series and ensure it is configured to use the correct axis. Adjust the line style, color, and markers for better visibility.4. Override Display Settings: If the axis labels or data representation do not align with the input values, use the "Override" feature in the chart properties to adjust the display settings. This can help in fine-tuning the appearance of the line.5. Check Data Consistency: Ensure that the data for the line and bars is correctly formatted and linked. Any inconsistencies in data formatting can lead to display issues.By following these steps, you can effectively adjust the line in your combo chart to align with the bars while maintaining its proper slope and representation. Let me know if you need further assistance!0
Thanks, Isabel. After much tinkering I got it to work. Using decimals was key. Appreciate your help!
0
댓글
댓글 3개