The automated table builder creates structured tables that automatically update when your data changes. Instead of applying manual formats to specific cells, you define formatting rules based on the table's structure, such as group levels, totals, or value fields. This ensures formatting stays consistent even as rows move, data is refreshed, or the table grows to break across pages.
This approach is especially useful for complex reporting scenarios, such as creating a schedule of investments (SOI) table. In traditional reports, formatting is location-based, so when a data refresh moves a label to a new row, the formatting no longer applies to the right data. Automated table builder anchors formatting to the table's structure instead, so styles follow the data no matter where it lands.
With automated tables, you can:
- Apply formatting rules to data elements (for example, apply bold to all level one group rows or all total rows)
- Maintain consistent formatting as data updates or shifts
- Automatically manage grouping, subtotals, and repeated headers
- Keep metadata like XBRL tags and footnotes aligned with the correct data
This feature is only available in select solutions. Contact your Customer Success Manager with questions about availability.
Dataset requirements
Before creating an automated table, verify that your dataset meets the following requirements. Missing or invalid data can prevent the table from publishing.
Note: Automated tables don't support links, range links, or smart links.
Structure and layout
- Flat dataset: Use a two-dimensional table with a single header row followed by data rows.
- Unique headers: Each column must have a unique, non-empty header. Duplicate headers can't be used in the table builder.
- No trailing data: For spreadsheets, remove unused rows and columns, placeholder formulas, or information beyond your dataset. These can prevent the table from being published.
Data integrity and mapping
- Unique identifier (primary key): Include a column with a unique value for each row (for example, CUSIP, SEDOL, or an internal ID). This ensures each record can be identified and tagged correctly.
- Complete grouping fields: Any fields used for grouping (such as asset class, region, or entity) must be fully populated. Missing values will prevent the table from being published.
Connect to your data
Automated tables connect directly to your data, allowing updates to happen automatically. Your table will adjust formatting and layout to match the latest data without any manual effort.
To connect to your data:
- In the Edit toolbar, click Insert.
- Click Table and hover over Automated table.
- Choose a connection type from the menu.
Which data source is right for you?
- Learn more about connecting to spreadsheets
- Learn more about connecting to Wdata queries
- Learn more about connecting to shared data
- Learn more about connecting to source reports
Automated table builder layout
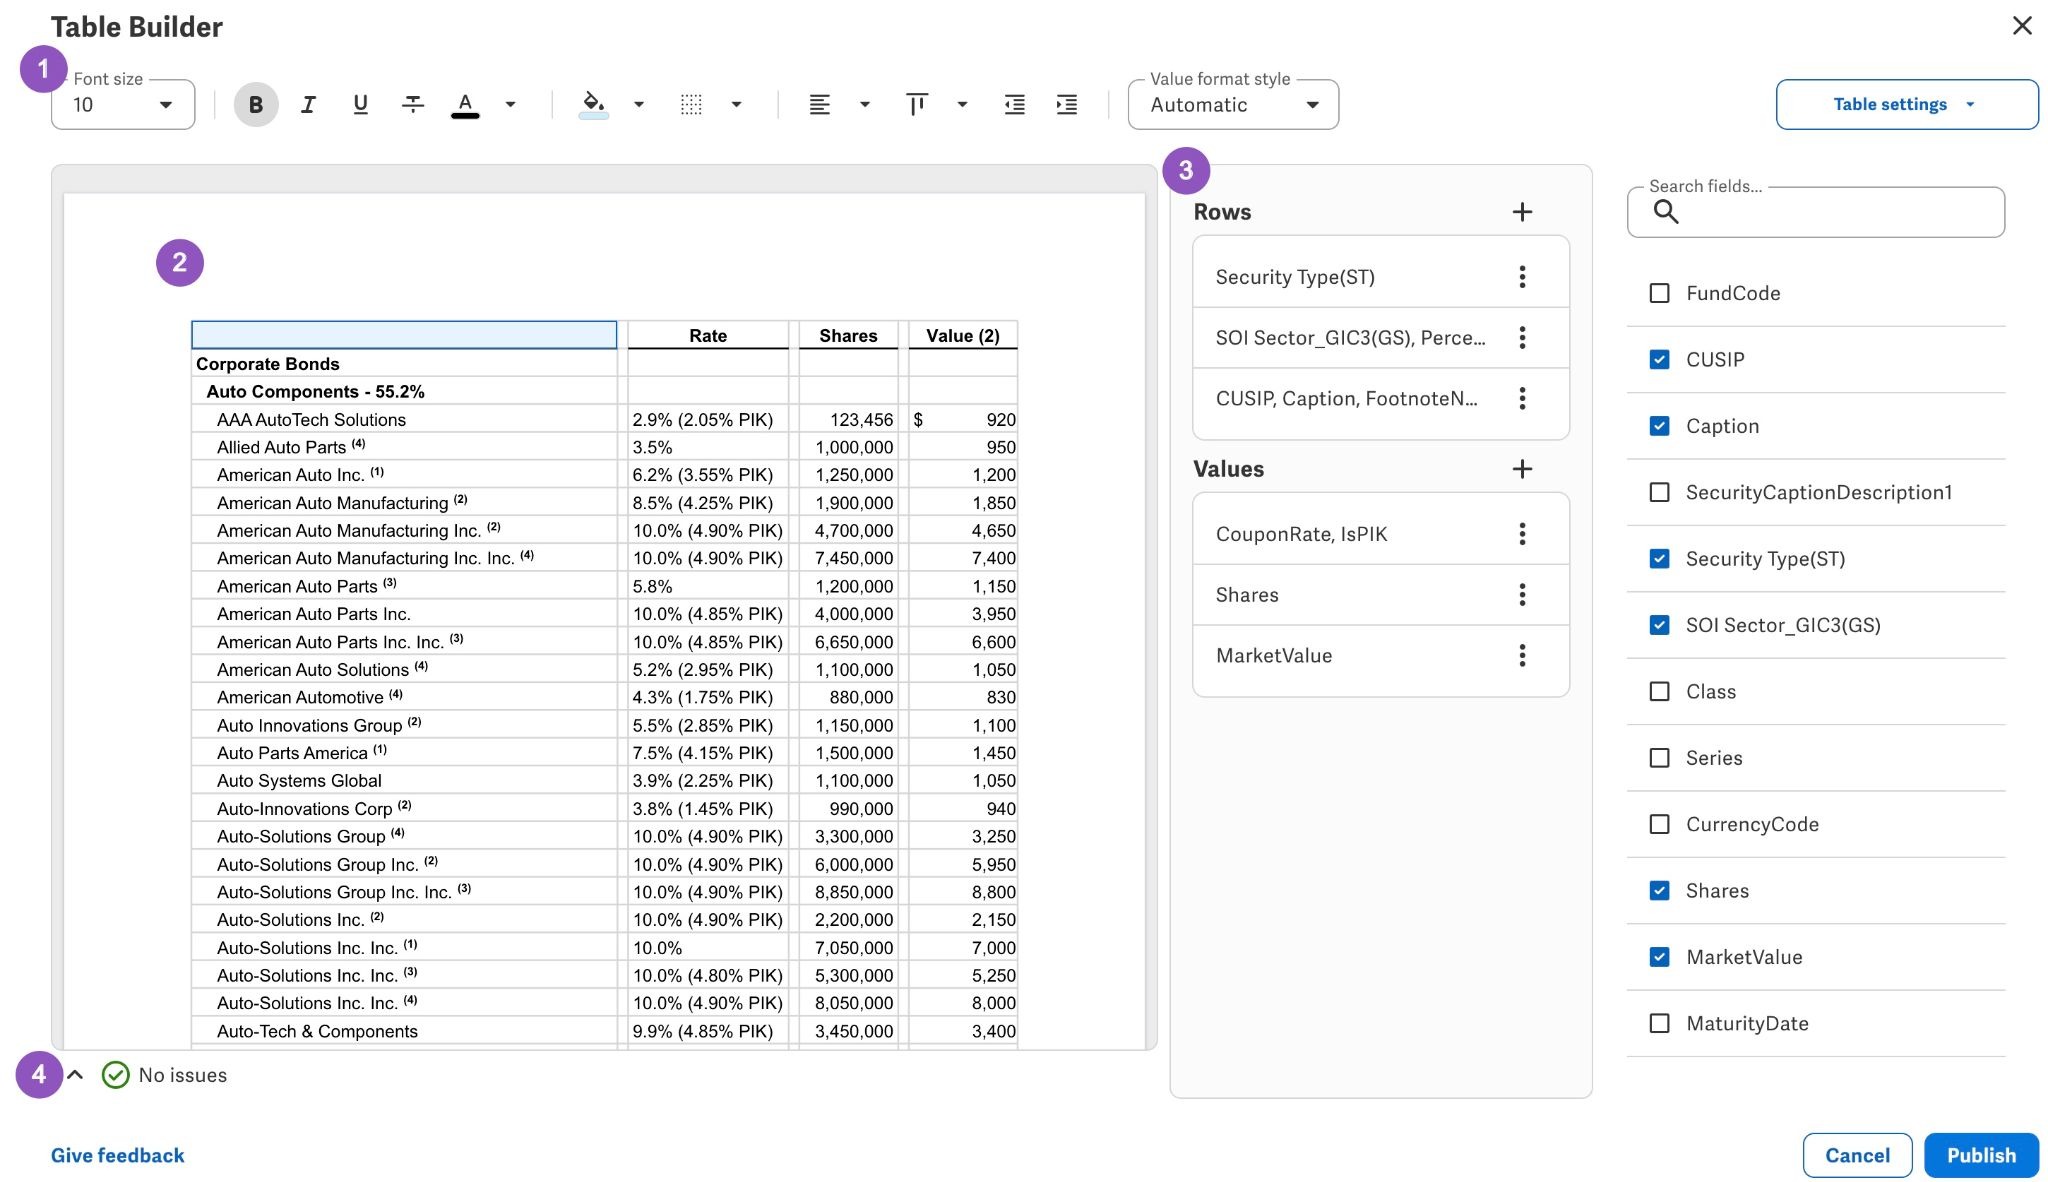
- Formatting toolbar: Apply formatting to the selected table elements.
- Table preview: Preview changes and select table elements.
- Panels: Configure the table layout and display options.
- Issues console: View warnings and errors that affect the table. Learn more.
Define your table's layout
You can add fields to your table. While you're making changes, the table preview on the left will automatically update.
Add fields by clicking the + icon, or drag fields into the Rows or Values sections.
Note: Data rows (which is the last field in the list) doesn't aggregate like a classic pivot table would. However, it will spill their values one-to-one.
Tip: Establish your table layout first to ensure that any display configurations that have been set up won't get removed if fields are reordered.
Add custom rows
Add custom rows below your table to configure extended disclosures, such as Assets in excess of liabilities or Total net assets.
To add a custom row:
- Click the (+) button in the Rows section.
- Select Add custom row below.
- Enter labels and values in Row label and Column values for row to fill in each cell of the custom row. Learn how to use the label and value editor in Customize table display.
- To rename your custom row, click the (⋮) menu and select Rename, then enter the new text.
Format your table
A key benefit of formatting your table within the table builder is that the formatting is tied to the table's structure, not specific cell references. This means the formatting will automatically adapt as your data changes, unlike formatting applied to fixed cell ranges (for example, bold applied to A1:H1), which will not update correctly when the data shifts.
To add formatting:
- Make a selection in the table preview.
- Use the formatting toolbar above the table preview to apply your desired formatting.
Example: Format group rows
Easily add formatting to your group and data rows for better visual organization.
To add formatting to group rows:
- Select a level 1 group and bold it.
- Select a level 2 group, bold and indent.
- Select data rows and indent twice.
Example: Add a bottom border to the last cell in a group
Quickly add conditional formatting for the last cell in each group.
To apply a bottom border to the last group cell:
- Select values in MarketValue and right-click.
- Click Select last in group only.
- In the formatting toolbar, apply the bottom border.
Customize table display
Row labels
You can customize how your row labels are displayed.
To customize row labels:
- Select the row in the table preview or in the Rows section.
- In the settings panel, find Row label beneath the Display options section. Click Edit row label to open the editor.
- In the text input, you can add text and use the + icon to add additional fields to the row label.
Within the editor, you can:
- Enter text, spaces, and line returns.
- Format elements using the expression's format toolbar.
- Add fields to be displayed inline, or to be totaled inline, with the existing row label.
Example: Inline totals
Quickly add inline totals for each group row label.
To add inline totals:
- Select a row in the table preview or in the Rows section.
- Click Edit row label.
- Click into the input box and place the cursor after the existing row name.
- Type in a dash ( - ).
- Add another field by clicking the + icon.
- Select your desired field. For example,
PercentOfInvestments.
To format the field:
- Make sure that your desired field is selected.
- Click Value format style in the row label toolbar.
- Select your desired format. For example,
Percent.
Column headers
You can customize the column header text and cell values.
To customize value columns:
- Select a value column in the table preview or in the Values section.
- In the Settings panel, find Column header beneath the Display options section.
- Click Edit column header to open the editor.
- In the text input, type or remove text and apply formatting. For example, you can change the column header from
MarketValuetoValue.
Column width
You can customize the column width of any field in the Values section.
To customize column width:
- Select a value column in the table preview or in the Values section.
- In the Settings panel, find Dimensions and spacing beneath the Display options section.
- Select Fixed width and enter a width in points in Column width.
Fit to contents is the default column width option. This automatically adjusts the column width to fit the content.
Example: Add units to a column header
You can add descriptive text, such as units, in a column header.
To add descriptive text to a column header:
- Select a value column.
- Click Edit column header.
- Press [Enter] to add a new line, if needed.
- Type the unit, such as $000.
Cell values
You can customize how values are displayed in a value column.
To customize cell values:
- Select a value column in the table preview or in the Values section.
- In the Settings panel, find Cell value beneath the Display options section.
- Click Edit cell value to open the editor.
- In the text input, type text or click the + icon to add additional dataset fields.
Example: Combine multiple fields in a cell value
You can display multiple dataset fields within the same cell value.
To combine multiple fields:
- Select a value column.
- Click Edit cell value.
- Click the + icon.
- Add the desired fields. For example, add
BenchmarkRateandIsPIKfields alongside the existing value column'sCouponRatefield to form a complex cell value such asS+ 3.89% (1.25% PIK). - Arrange the fields and any separator text as needed.
Totals
You can easily add group or grand totals to your table and customize its label display.
To total a group:
- Select the grouping row in the table preview or in the Rows section.
- In the Settings panel, navigate to the Totals section.
- In Add total below, checkbox at least one value column to add a total.
Note: Totals won't be enabled if no value columns have been added.
To include a total row label:
- Go to Total row options and checkbox Show total row label.
- Click Edit total row label to customize the total row label, if needed.
- Use the text input to type text and the + icon to add additional fields to your custom total row label.
To learn how to add inline totals to a total row label, go to Example: Inline totals.
To add a grand total and customize its label:
- Go to Table settings and select Grand total.
- In the Add grand total below section, checkbox at least one value column to add a grand total.
To include a grand total row label:
- Go to Grand total row options and checkbox Show grand total row label.
- Click Edit grand total row label to customize the grand total row label, if needed.
- Use the text input to type text and the + icon to add additional fields to your custom total row label.
Manage your table
Below, are actions that you can take with your automated table.
Publish your table
To save your table and publish it to the document, click Publish in the bottom right corner of the table builder.
Note: If the Publish button is disabled, check the issues console for errors or verify that changes have been made to the table.
Edit your table
To go back into the table builder and make edits, right-click on the table within your document and select Edit automated table.
Refresh your table's data
To ensure your table has the latest data, navigate to the Connections panel, find the connection for your automated table, and click the refresh icon.
When the data for your table is refreshed, all of the formatting, repeating content, and tags will automatically follow what they were applied to. This reduces the need for manual reformatting.
Learn more about how to manage your data source connections.
View issues
You can use the Issues console to view errors and warnings within your table.
To view issues in the table builder, locate the Issues console in the bottom-left corner of the table preview area. Use the expand (^) icon to open the Issues console.
The issues console displays two types of issues:
- Errors: These will prevent you from saving the table and must be resolved.
-
Errors for disconnected annotations: Some changes disconnect annotations in the published table, such as XBRL tags or comments. These changes trigger an error message, but you can still publish the table if you want to keep the change.
- Warnings: You can still save the table, but they may have non-critical effects on the table.
To navigate to any issue found in the Issues console, click the link in the Location column. This will navigate you to that specific issue.