Customize the position of data labels to ensure that your charts are easy to understand. Make sure that your data labels are clearly visible. Data labels ware positioned differently for different types of charts. This article demonstrates how to set label positions in column and bar charts.
Position column and bar chart labels
If you select All Series for a column, bar, combo or waterfall chart, the data labels will be placed automatically. If you select a single series, the label position options include Outside End, Inside End, Center and Inside Base.

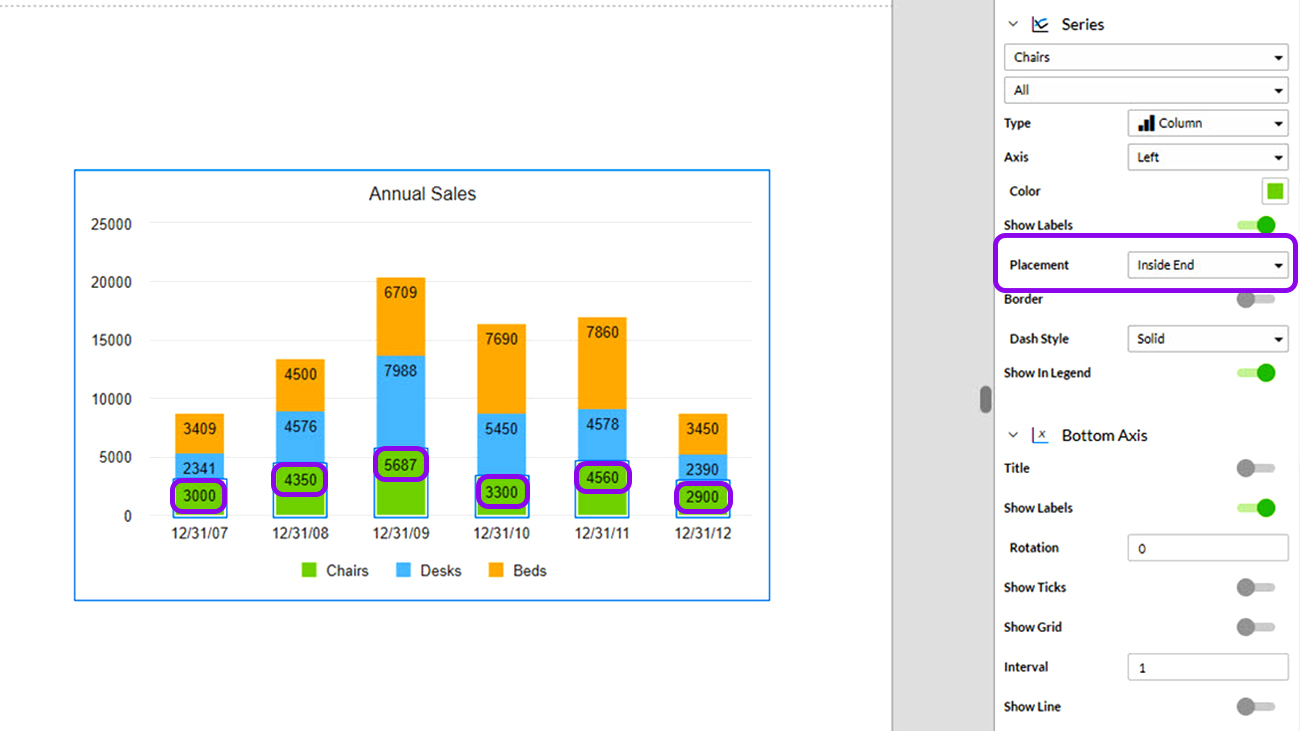
Stacked column and bar chart labels
For stacked column and bar charts, you can set the data label positions independently for each series. Click on the series in your chart or select the series from the Placement drop-down menu in the Chart Properties panel. For Combo charts, adjust each series to ensure the best visibility for the data labels.
For waterfall charts, you can set data label position for the columns that aggregate separately from the label for the final column for the total. Use the drop down menu to select the series or the total to set the data label positions.